Audrey Wilkinson offers help with standard math curriculum topics as well as custom programming.
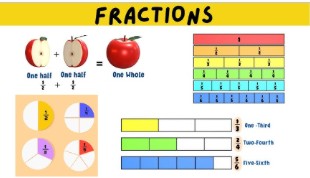
Fractions
Decimals
Integers
Exponents
Ratios and Rates
Percentages
Expressions and Equations
Inequalities
Angles
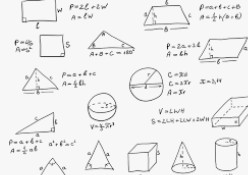
Perimeter
Area
Volume
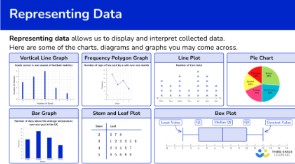
Data Displays
Statistics
Probability
Financial Literacy
Units of Measurement
Square and Cube Roots
Proportional Relationships
Graphing Linear Equations
Scale Drawings
Transformations
Congruence and Similarity
Scientific Notation
Pythagorean Theorem
Functions
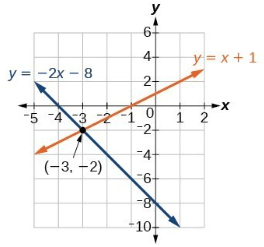
Systems of Equations
Sequences
Absolute Value Equations
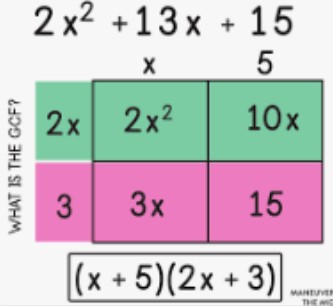
Polynomials
Quadratic Functions
Radical Expressions
Matrices
Art with Mathematics
STEM Projects
Basic Computer Science
Eastern Maine Math League Practice
MathCOUNTS Practice
Visual representation of fractions using apples and color-coded segments.Visual representation of addition on a number line, illustrating the sums of different values.Mathematical formulas for calculating the area, perimeter, and volume of various geometric shapes.Various types of charts used for representing data visually.Illustration of the 50/30/20 budget rule, breaking down allocations for needs, savings, and wants.Diagram illustrating the properties of parallel lines cut by a transversal, highlighting corresponding, alternate exterior, vertical, alternate interior, and same side exterior angles.Visual representation of factoring the polynomial 2x² + 13x + 15, illustrating the GCF and derived factors (x + 5)(2x + 3).Graph depicting two linear equations, y=-2x-8 (in blue) and y=x+1 (in orange), with the intersection point labeled at (-3, -2).